Troubleshoot your Node.js code like a Pro!
Mastering the Art of Node.js Debugging: Tips, Tricks, and Real-Life Examples
Ever felt stuck while trying to troubleshoot Node.js issues and found that the internet has disappointingly limited content to help you out? In this article, I've got your back with some awesome techniques to troubleshoot Node.js like a champ.
I'll walk you through real examples, making the process super easy to grasp. No more frustrations – let's dive in and become Node.js troubleshooting experts together! 🚀
Tools and Techniques
- Using Chrome Debugger:
Since Chrome by default does not support Node.js debugging. So for this to work you need to tweak the start script in package.json.
  "scripts": {
    "start": "node --inspect app.js"
  },
Note the --inspect flag that I am using, make sure to add it.
Let's take this sample code:
import express from "express"
const app = express();

app.get('/', (req, res) => {
    console.log("I am inside the server!");
    debugger;
    res.send("Response");
})

app.listen(4000);
console.log("Server Started");
The debugger keyword acts like a breakpoint. Now, whenever you start up a server with yarn run start, you will notice that it indicates a debugger is running. Next, open up Chrome DevTools and wait for a few seconds. You will see a Node.js icon appearing at the top of the DevTools panel. Click on this icon, and now in the Sources tab, you will notice that the debugger breakpoint has been hit. Now you can debug your Node.js code just like you would debug regular JavaScript code.
If you are still not convinced about this approach and want something even better, you can utilize it directly within your Code Editor. The next approach is something you would love and what I use as well.
- Using Built-In Editor debugger:
In this section, I will be using VScode and the approach should be pretty similar in any other code editor.
Firstly, we need to set up the debugger configuration. We can do that by creating a launch.json file.
Go to the Run and Debug section in the left pane of the sidebar. Click on "Create a launch.json" and select Node.js.
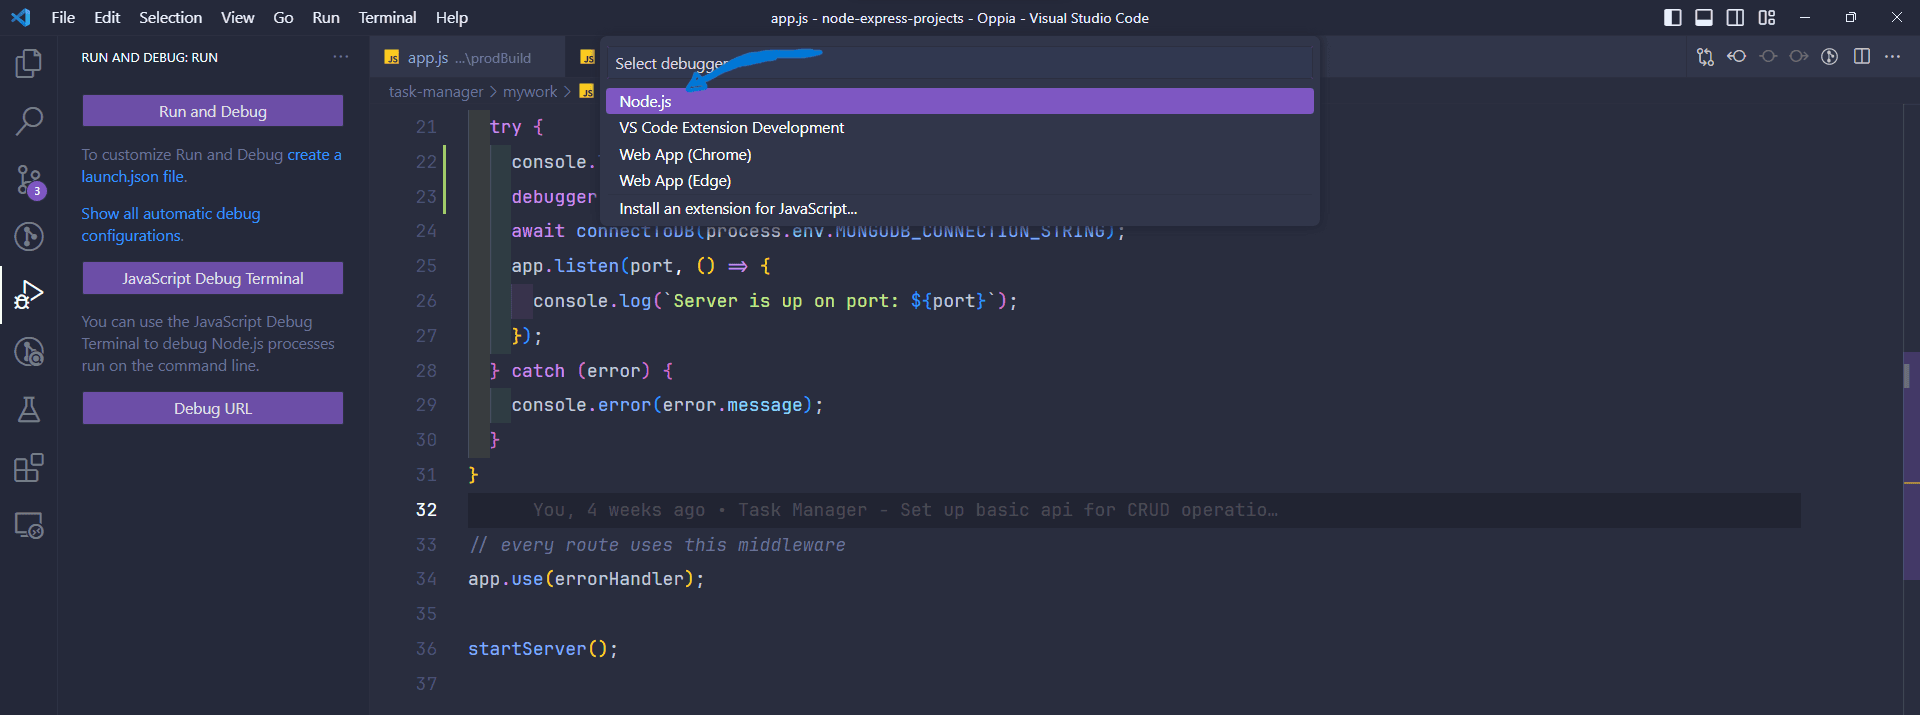
This will create a launch.json file in the root of the project inside the .vscode folder. The default configuration should be similar to the below json.
{
  "version": "0.2.0",
  "configurations": [
    {
      "type": "node",
      "request": "launch",
      "name": "Launch Program",
      "skipFiles": [
        "<node_internals>/**"
      ],
      "program": "${workspaceFolder}\\jobs-api\\mywork\\app.js"
    }
  ]
}
Since we do not want to launch our app in debug mode rather we want to attach our debugger to an already running process. For more information on what is the difference between Launch and Debug visit here.
On the bottom right corner of the launch.json file click on Add Configuration and select Node.js: Attach to Process and also select the same in the debugger dropdown.
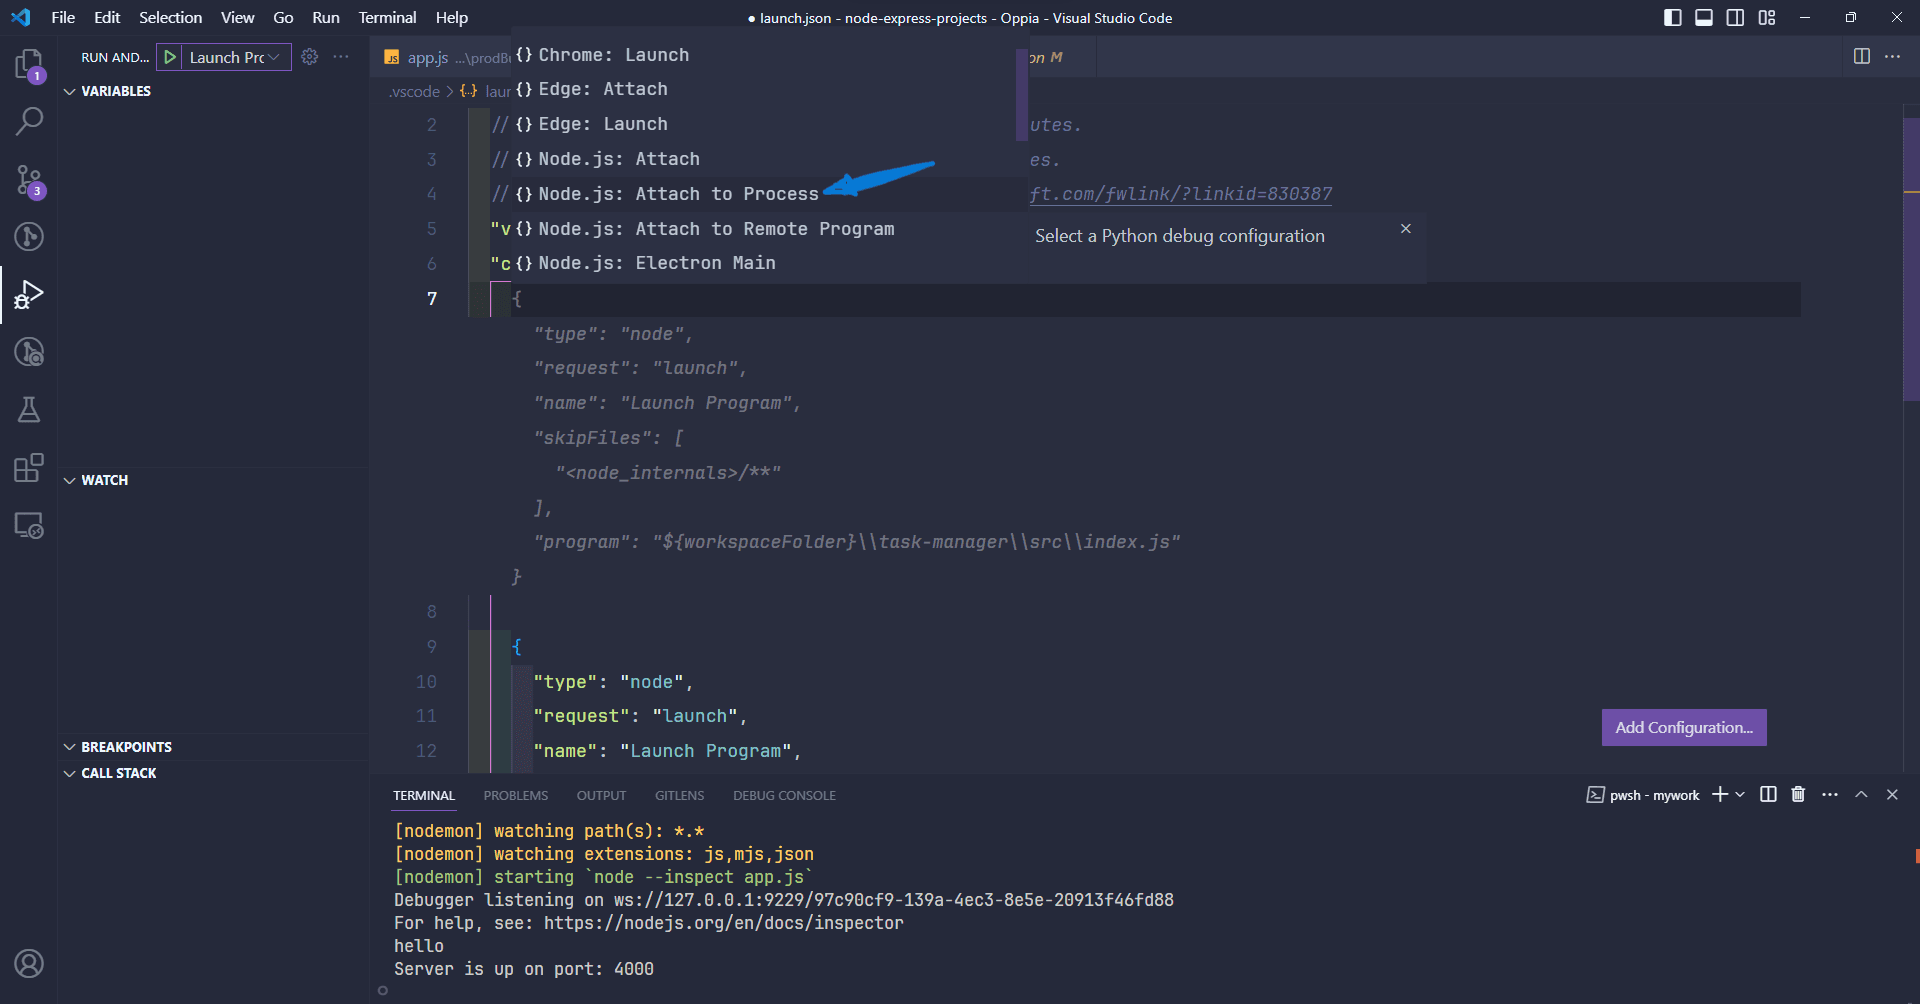
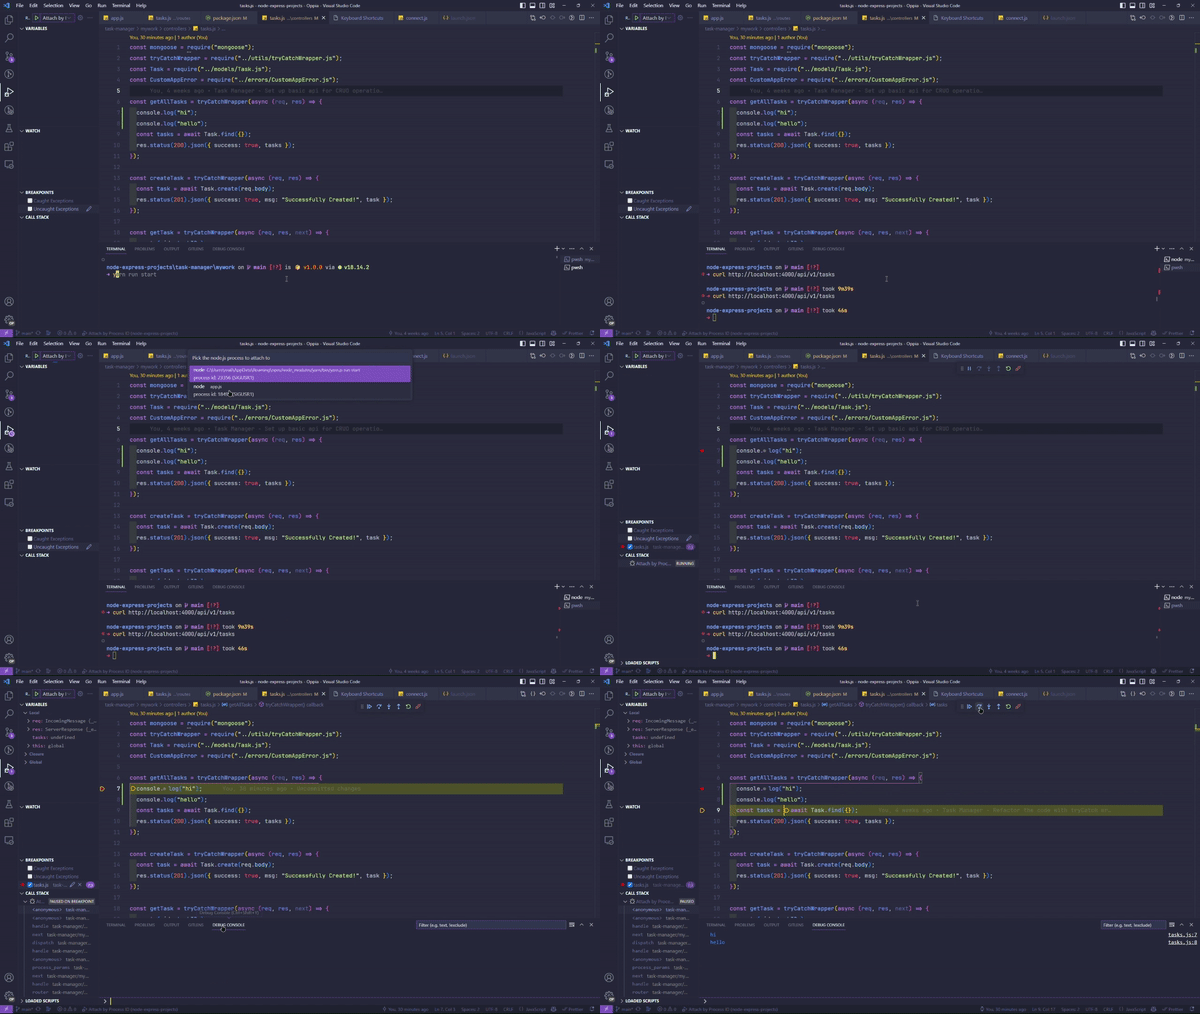
And now the process is pretty straightforward. Simply add a breakpoint wherever you want in the app.js file or any controllers you have set up inside the app.
Spin up the server as usual and make a GET/POST request to that particular route. You can do this either in the command line itself with curl command or by navigating to the particular URL in the browser.
Now the breakpoint should trigger in your VScode.
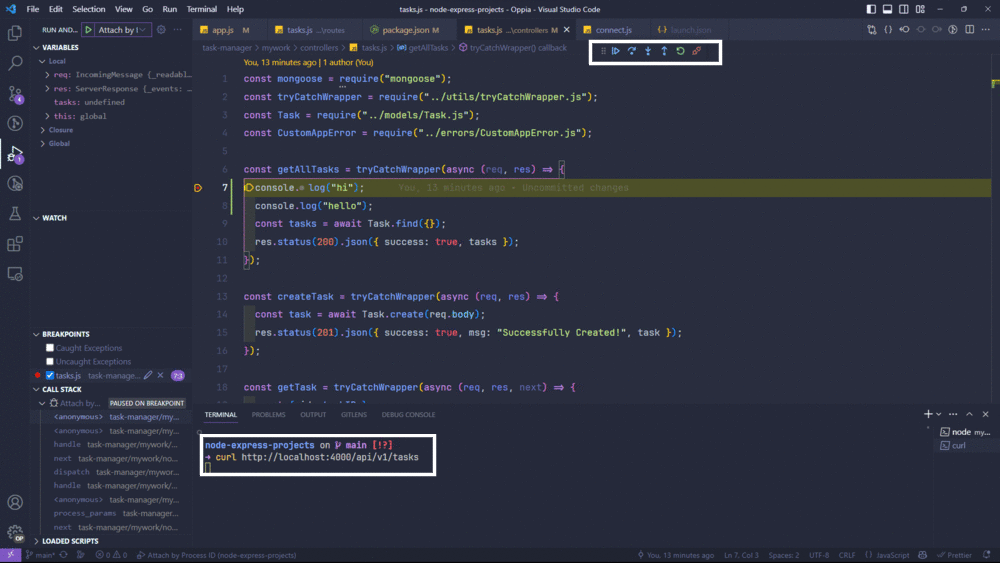
As you can clearly see, the curl command is not returning anything because the breakpoint is triggered. So now we can use the VScode step in, pause, step over tools. If you are having trouble refer to this GIF below:
So now you must have a basic understanding of how to debug Node.js code directly in the browser and in the Code Editor as well. Congratulations!🎊🎊
Implementation in Real World Code
Enough of the basic understanding, now we will practice it in a real-life code where we use all these things we have learned and troubleshoot the reason for the failing code.
Let's take this failing code:
import express from "express";
const app = express();

const port = 3000;

function calculateFactorial(n) {
  if (n < 0) {
    return 1;
  } else {
    return n * calculateFactorial(n - 1);
  }
}

app.get("/", (req, res) => {
  res.send("Welcome to the Factorial Calculator");
});

app.get("/factorial/:number", (req, res) => {
  const number = parseInt(req.params.number);
  const factorial = calculateFactorial(number);
  res.send(`The factorial of ${number} is: ${factorial}`);
});

app.listen(port, () => {
  console.log(`Server is listening on port ${port}`);
});
If you are an experienced developer, you must have already spotted the bug. But let's forget about it and go through the thought process together.
Having taken a brief look at the code, everything seems to be working absolutely fine. However, when we go to the /factorial/:id endpoint and enter any number, the output always appears to be 0.
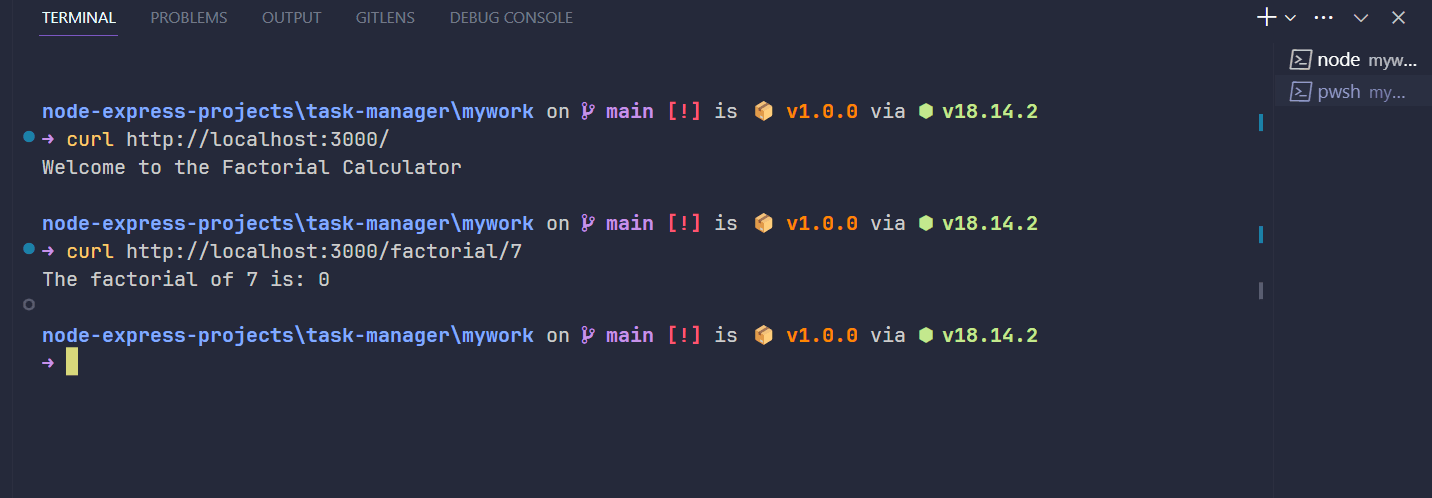
Let's find out the real reason for it. Set a breakpoint at line 19 and step over each line. We can observe that the number variable correctly parses as an integer, but the factorial variable always seems to store the value 0. This is not the intended behavior, and the problem seems to lie in the calculateFactorial function.
Now that we are sure that the calculateFactorial function is the culprit, let's set up a breakpoint at line 20 and step into the function. Go through each recursion step and notice that everything seems to work fine until the value of n is greater than 0. However, as soon as the value of n == 0, the function returns the value 0.
Ahh, I forgot to handle the case when the value of 'n' is 0. That's why, when there is any value stored in the number variable, it was getting multiplied by zero, resulting in the overall value being 0.
Modify the function to also handle the n == 0 case. The calculateFactorial code should now look like this.
function calculateFactorial(n) {
  if (n == 0) {
    return 1;
  } else {
    return n * calculateFactorial(n - 1);
  }
}
Now, everything should work as expected🤞. Voilà!

I know this was a pretty simple and silly example. Even though it was a simple example, we still learned how to debug Node.js and applied it in real-world code.
Wrap Up!
In conclusion, becoming a Node.js troubleshooting pro will boost your programming skills. With debugging tools and techniques like these, you can fix bugs efficiently.
Embrace debugging, enjoy coding!
Follow me on LinkedIn 🌍: https://linkedin.com/in/shrijal007
Follow me on Github 👨💻: https://github.com/shricodev