Learn to monitor your Python Application Like a PRO! 🧙♂️🪄
TL;DR
In this easy-to-follow tutorial, you'll discover how to keep an eye on your Python application using distributed tracing.
What you will learn: ✨
-
How to build microservices in Python 🐍.
-
Setting up Docker containers 📦 for microservices.
-
Configuring Kubernetes for managing microservices.
-
Integrating a tracing backend for visualizing the traces 🕵️♂️.
Ready to light up your Python application monitoring skills? 🔥

Setup Instructions
🚨 In this section of the blog, we'll be building a dummy Python microservices application. If you already have one and are following along, feel free to skip this part.
Create the initial folder structure for your application as shown below. 👇
mkdir python-microservices && cd python-microservices
mkdir src && cd src
mkdir microservice1 microservice2
Setting Up the Server 🖥️
For demonstration purposes, I will create two microservices that will communicate with each other, and eventually, we can use that to visualize distributed tracing.
Building and Dockerizing Microservice 1
Inside the /microservice1 directory, create a new Python virtual environment, install the necessary dependencies, and initialize a Flask application.
🚨 I assume you are following along on a Unix-based machine. If you are on a Windows machine, some commands will differ.
cd microservice1
python -m venv .venv
source .venv/bin/activate
💡 If you are on a fish shell, run the below command to activate the virtual environment.
source .venv/bin/activate.fishInstall the required dependencies:
pip install Flask requestsGet the list of installed dependencies in the requirements.txt so that we can later use it in our container to install the dependencies.
pip freeze > requirements.txtCreate a new file called app.py and add the following lines of code:
# 👇 src/microservice1/app.py
import socket
import requests
from flask import Flask, jsonify, render_template

app = Flask(__name__)

def user_os_details():
    hostname = socket.gethostname()
    hostip = socket.gethostbyname(hostname)
    return hostname, hostip

@app.route("/")
def index():
    return "<p>Welcome to Flask microservice 1</p>"

@app.route("/health")
def health():
    return jsonify(status="Microservice 1 Running...")

@app.route("/get-users")
def get_users():
    response = requests.get("http://microservice2:5001/get-gh-users")
    return render_template("index.html", users=response.json())

@app.route("/os-details")
def details():
    host_name, host_ip = user_os_details()
    return jsonify(hostname=host_name, hostip=host_ip)

if __name__ == "__main__":
    app.run("0.0.0.0", 5000)
💡 If you've noticed, we're requesting data from
http://microservice2:5001/get-gh-users. You might be wondering, what is this microservice2? Well, we can use service names as host names within the same network in docker. We will build this service later once we finish writing and dockerizing this microservice.
As you can see, this is a very simple Flask application with a few endpoints. The user_os_details() function gets the Hostname and IP address of the machine.
The @app.route("/") and @app.route("/health") decorators define the root and "/health" endpoints of the Flask app. The "/health" endpoint will be used later to check the container health ❤️🩹 in the Dockerfile.
The @app.route("/get-users") and @app.route("/os-details") decorators define the "/get-users" and "/os-details" endpoints. The "/get-users" endpoint fetches GitHub users from microservice2 and passes them as props to the index.html file for rendering. Meanwhile, the "/os-details" endpoint displays system details. Finally, the application is run on port 5000.
Now, let's create the index.html file where we are rendering the received users from microservice2.
Create a new folder /templates and add an index.html file with the following contents:
<!-- 👇 src/microservice1/templates/index.html -->

<!DOCTYPE html>
<html lang="en">
<head>
  <meta charset="UTF-8">
  <meta name="viewport" content="width=device-width, initial-scale=1.0">
  <title>Microservice 1</title>
</head>
<body>
  <h1>Microservice 1</h1>
  <h2>This is the data received from microservice2:</h2>
  <p>{{ users }}</p>
</body>
</html>
Our first microservice is all ready. Let's dockerize it. Create a Dockerfile inside the /microservice1 directory and add the following lines of code:
🚨 Make sure to name it exactly
Dockerfilewith no extensions.
# 👇 src/microservice1/Dockerfile
# Use Python alpine as the base image.
FROM python:3.12.1-alpine3.18
# Optional: Upgrade pip to the latest version.
RUN pip install --upgrade pip
# Create a new user with fewer permissions.
RUN adduser -D lowkey
# Switch to user lowkey
USER lowkey
# Change the working directory to ~/app
WORKDIR /home/lowkey/app
# Copy the requirements.txt file required to install the dependencies.
COPY --chown=lowkey:lowkey requirements.txt requirements.txt
# Install the dependencies
RUN pip install -r requirements.txt
# Copy the rest of the files to the current directory in the docker container.
COPY --chown=lowkey:lowkey . .
# Expose port 5000
EXPOSE 5000
# Switch to the root user just for installing curl. It is required.
USER root
# Install curl. Alpine uses apk as its package manager.
RUN apk --no-cache add curl
# Switch back to user lowkey
USER lowkey
# Check the health of the container. The "/health" endpoint is used
# to verify the container is up and running.
HEALTHCHECK --interval=30s --timeout=30s --start-period=30s --retries=5 \
            CMD curl -f http://localhost:5000/health || exit 1
# Finally, start the application.
ENTRYPOINT [ "python", "app.py" ]
Create a .dockerignore file with the names of the files we don't want to push to the container.
__pycache__
.venv
README.md
Dockerfile
.dockerignore
Now, that is the entire setup for our first microservice. ✨
Building and Dockerizing Microservice 2
We will have a setup similar to microservice1, with just a few changes here and there.
Do the exact initial setup as we did for the microservice1. After that, in the /microservice2 folder, create an app.py file and add the following lines of code:
# 👇 src/microservice2/app.py
import random
import requests
from flask import Flask, jsonify, render_template

app = Flask(__name__)

def get_gh_users():
    url = "https://api.github.com/users?per_page=5"

    # Choose a random timeout between 1 and 5 seconds
    timeout = random.randint(3, 6)

    try:
        response = requests.get(url, timeout=timeout)
        return response.json()
    except requests.exceptions.Timeout:
        return {"error": "Request timed out after {} seconds".format(timeout)}
    except requests.exceptions.RequestException as e:
        return {"error": "Request failed: {}".format(e)}

@app.route("/")
def index():
    return "<p>Welcome to Flask microservice 2</p>"

@app.route("/get-gh-users")
def get_users():
    results = []

    # Loop through the number of requests and append the results to the list
    for _ in range(3):
        result = get_gh_users()
        results.append(result)

    # Return the list of results as a JSON response
    return jsonify(results)

@app.route("/health")
def health():
    return jsonify(status="Microservice 2 Running...")

@app.route("/os-details")
def details():
    try:
        response = requests.get("http://microservice1:5000/os-details").json()
        host_name = response["hostname"]
        host_ip = response["hostip"]
        return render_template("index.html", hostname=host_name, hostip=host_ip)
    except requests.exceptions.Timeout as errt:
        return {"error": "Request timed out after {} seconds".format(errt)}
    except requests.exceptions.RequestException as e:
        return {"error": "Request failed: {}".format(e)}

if __name__ == "__main__":
    app.run("0.0.0.0", 5001)
The @app.route("/") decorator defines the root endpoint of the Flask app, returning a welcome message. The @app.route("/health") decorator defines the "/health" endpoint, which can be used to check the health status of the container.
The @app.route("/get-gh-users") decorator defines the "/get-gh-users" endpoint, which uses the get_gh_users() function to fetch GitHub users and return them as a JSON response. Lastly, the @app.route("/os-details") decorator defines the "/os-details" endpoint, which retrieves operating system details from microservice1 and renders them in the index.html file. Finally, the application runs on port 5001.
Now, let's create the index.html file where we are rendering the received users from microservice2.
Create a new folder /templates and add an index.html file with the following contents:
<!-- 👇 src/microservice2/templates/index.html -->

<!DOCTYPE html>
<html lang="en">
<head>
  <meta charset="UTF-8">
  <meta name="viewport" content="width=device-width, initial-scale=1.0">
  <title>Microservice 2</title>
</head>
<body>
  <h1>Microservice 2</h1>
  <h2>This is the hostname and IP address received from the microservice1:</h2>
  <p>{{ hostname }} - {{ hostip }}</p>
</body>
</html>
Now, it's time to dockerize this microservice as well. Copy and paste the entire Dockerfile content for microservice1 and just change the port from 5000 to 5001.
Also, add a .dockerignore file and include the same files that we added when creating microservice1.
Now, that is the entire setup for our second microservice as well. ✨
Building Dockerfiles with Docker Compose
We will follow the best practices of image building by using Docker Compose instead of building each image manually. Here we have only two images, but imagine if we had hundreds or thousands of Dockerfiles. Building each manually would be a tedious task. 😴
In the root of the project, create a new file named docker-compose.yaml and add the following code:
services:
  microservice1:
    build:
      context: ./src/microservice1
      dockerfile: Dockerfile
    image: microservice1-image:1.0
    ports:
      - "5000:5000"
    restart: always

  microservice2:
    build:
      context: ./src/microservice2
      dockerfile: Dockerfile
    image: microservice2-image:1.0
    ports:
      - "5001:5001"
    restart: always
This Docker Compose file defines two services, microservice1 and microservice2. Each service is built using its respective Dockerfile located in the /src directory, with microservice1 mapped to port 5000 and microservice2 to port 5001.
The resulting images are tagged microservice1-image:1.0 and microservice2-image:1.0, respectively. Both services are set to restart always, making sure if the container fails it restarts.
Now, build the images using the following command:
docker compose build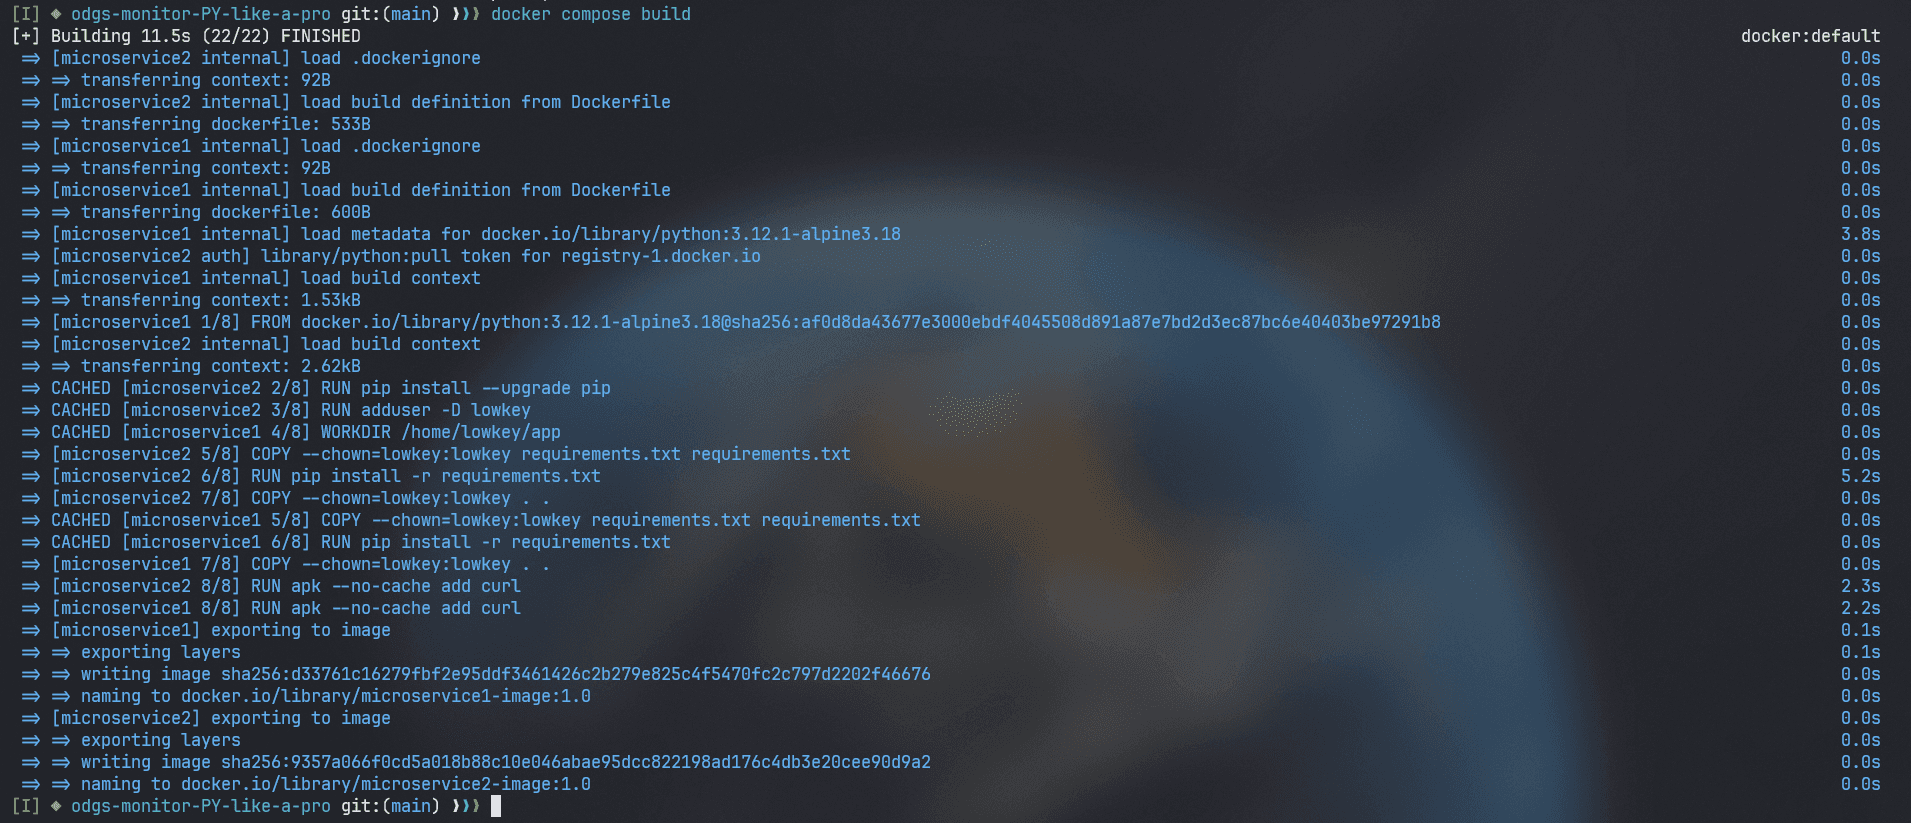
Deployment on Kubernetes 🧑🚀
Make sure Minikube is installed, or follow this link for installation instructions. 👀
Create a new local Kubernetes cluster, by running the following command. We will need it when setting up Odigos and Jaeger.
Start Minikube: 🚀
minikube start
Since we are running on a local Kubernetes environment, we need to point our shell to use the minikube's docker-daemon.
To point your shell to minikube's docker-daemon, run:
minikube -p minikube docker-env | sourceAnd now, when running any Docker commands such as docker images or docker ps, you will see what is inside Minikube rather than what you have locally on your system.
Now that we have both of our microservices ready and dockerized, it's time to set up Kubernetes for managing these services.
At the root of the project, create a new folder /k8s/manifests. Inside this folder, we will add deployment and service configurations for both of our microservices.
-
Deployment Configuration 📜: For actually deploying the containers on the Kubernetes Cluster.
-
Service Configuration 📄: To expose the pods to both within the cluster and outside the cluster.
First, let's create the manifest for the microservice1. Create a new file microservice1-deployment-service.yaml and add the following content:
// 👇 k8s/manifests/microservice1-deployment-service.yaml
version: apps/v1
kind: Deployment
metadata:
  name: microservice1
spec:
  selector:
    matchLabels:
      app: microservice1
  template:
    metadata:
      labels:
        app: microservice1
    spec:
      containers:
        - name: microservice1
          image: microservice1-image:1.0
          imagePullPolicy: Never
          resources:
            limits:
              memory: "200Mi"
              cpu: "500m"
          ports:
            - containerPort: 5000
---
apiVersion: v1
kind: Service
metadata:
  name: microservice1
  labels:
    app: microservice1
spec:
  type: NodePort
  selector:
    app: microservice1
  ports:
    - port: 8080
      targetPort: 5000
      nodePort: 30001
This configuration deploys a microservice named microservice1 with resource limits of 200MB memory 🗃️ and 0.5 CPU cores. It exposes the microservice internally on port 5000 through a Deployment and externally on NodePort 30001 through a Service.
🤔 Remember the
docker-compose buildcommand we used when building our Dockerfiles, especially the image names? We are using the same images to create the containers.
It is accessible on port 8080 within the cluster. We assume microservice1-image:1.0 is locally available with imagePullPolicy: Never. If this is not in place, it would attempt to pull the image from the Docker Hub 🐋 and fail.
Now, let's create the manifest for microservice2. Create a new file named microservice2-deployment-service.yaml and add the following content:
// 👇 k8s/manifests/microservice2-deployment-service.yaml
apiVersion: apps/v1
kind: Deployment
metadata:
  name: microservice2
spec:
  selector:
    matchLabels:
      app: microservice2
  template:
    metadata:
      labels:
        app: microservice2
    spec:
      containers:
        - name: microservice2
          image: microservice2-image:1.0
          imagePullPolicy: Never
          resources:
            limits:
              memory: "200Mi"
              cpu: "500m"
          ports:
            - containerPort: 5001
---
apiVersion: v1
kind: Service
metadata:
  name: microservice2
  labels:
    app: microservice2
spec:
  type: NodePort
  selector:
    app: microservice2
  ports:
    - port: 8081
      targetPort: 5001
      nodePort: 30002
It is similar to the manifest for microservice1, with just a few changes.
This configuration deploys a microservice named microservice2 and exposes it internally on port 5001 through a Deployment and externally on NodePort 30002 through a Service.
Accessible on port 8081 within the cluster, assuming the microservice2-image:1.0 is locally available with imagePullPolicy: Never.
Once, this is all done, make sure to apply these configurations and start the Kubernetes cluster with these services. Change the directory to /manifests and execute the following commands:
kubectl apply -f microservice1-deployment-service.yaml
kubectl apply -f microservice2-deployment-service.yaml
Check that both our deployments are Running by executing the following command:
kubectl get pods
Finally, our application is ready and deployed on Kubernetes with the necessary deployment configurations. 🎊
Installing Odigos 🧑💻
💡 Odigos is an open-source observability control plane that enables organizations to create and maintain their observability pipeline. In short, we will use Odigos to auto-instrument our Python application.
ℹ️ If you are running on a Mac run the following command to install Odigos locally.
brew install keyval-dev/homebrew-odigos-cli/odigosℹ️ If you are on a Linux machine, consider installing it from GitHub releases by executing the following commands. Make sure to change the file according to your Linux distribution.
ℹ️ If the Odigos binary is not executable, run this command
chmod +x odigosto make it executable before running the install command.
curl -LJO https://github.com/keyval-dev/odigos/releases/download/v1.0.15/cli_1.0.15_linux_amd64.tar.gz
tar -xvzf cli_1.0.15_linux_amd64.tar.gz
./odigos install
If you need more brief instructions on its installation, follow this link.
Now, Odigos is ready to run 🚀. We can execute its UI, configure the tracing backend, and send traces accordingly.
Connecting Odigos to a Tracing Backend ✨
💡 Jaeger is an open source, end-to-end distributed tracing system.
Setting up Jaeger ✨
For this tutorial, we will use Jaeger 🕵️♂️, a popular open-source platform for viewing distributed traces in a microservices application. We will use it to view the traces generated by Odigos.
For Jaeger installation instructions, follow this link. 👀
To deploy Jaeger on a Kubernetes cluster, run the following commands:
kubectl create ns tracing
kubectl apply -f https://raw.githubusercontent.com/keyval-dev/opentelemetry-go-instrumentation/master/docs/getting-started/jaeger.yaml -n tracing
Here, we are creating a tracing namespace and applying the deployment configuration 📃 for Jaeger in that namespace.
This command sets up the self-hosted Jaeger instance and its service.
Run the below command to get the status of the running pods:
kubectl get pods -A -wWait for all three pods to be Running before proceeding further.

Now, to view the Jaeger Interface locally, we need to port forward. Forward traffic from port 16686 on the local machine to port 16686 on the selected pod within the Kubernetes cluster.
kubectl port-forward -n tracing svc/jaeger 16686:16686This command creates a tunnel between the local machine and the Jaeger pod, exposing the Jaeger UI so you can interact with it.

Now, on http://localhost:16686, you should be able to see the Jaeger instance running.
Configuring Odigos to Work with Jaeger 🌟
ℹ️ For Linux users, go to the folder where you downloaded the Odigos binaries from GitHub releases and run the following command to launch the Odigos UI.
./odigos uiℹ️ For Mac users, just run:
odigos uiVisit http://localhost:3000 and you will be presented with the Odigos interface where you will see both deployments in the default namespace.
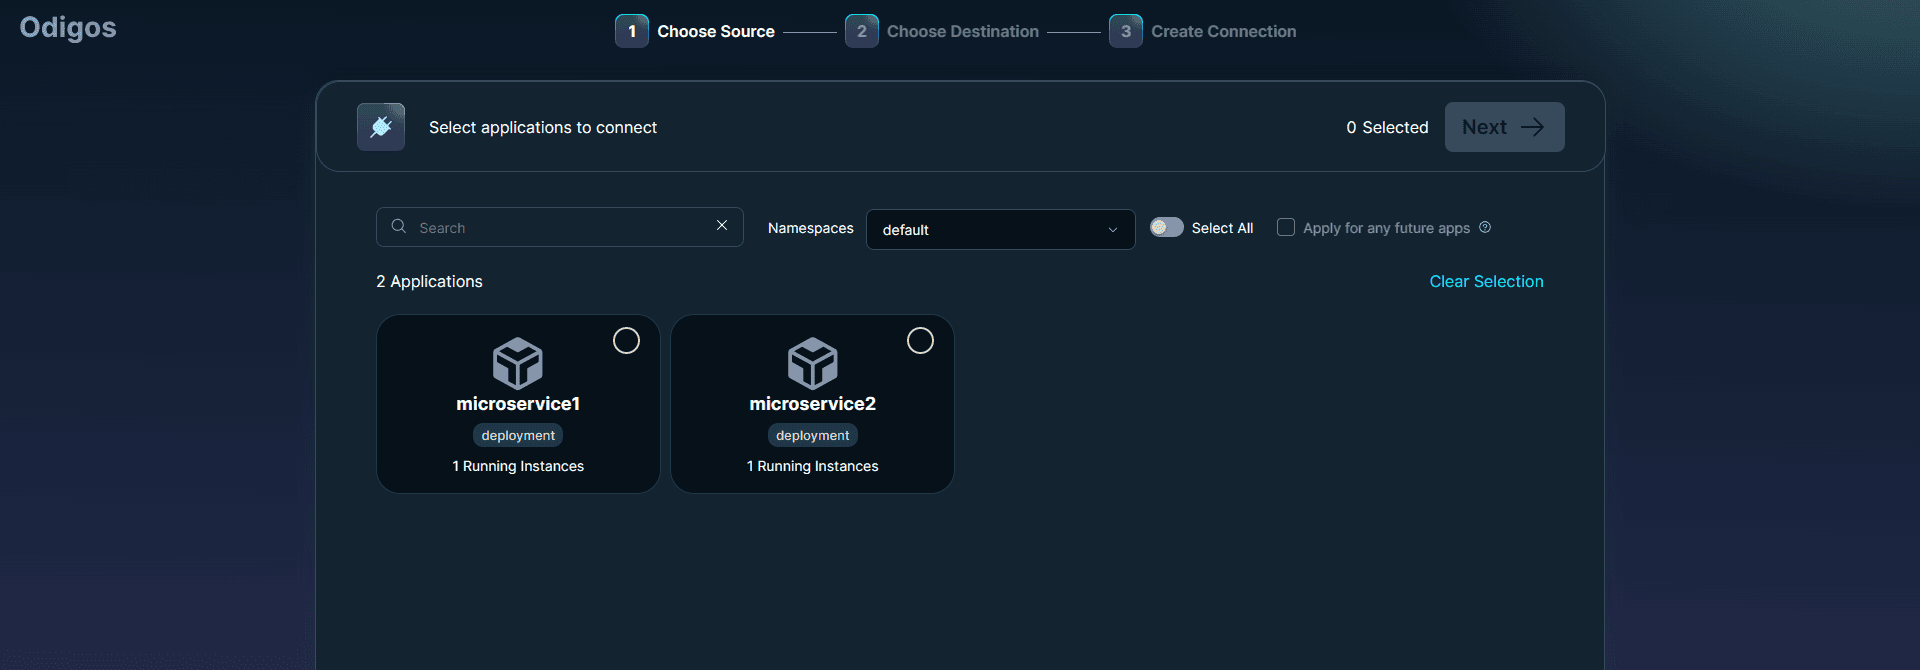
Select both of these and click Next. On the next page, choose Jaeger as the backend, and add the following details when prompted:
-
Destination Name: Give any name you want, let's say python-tracing.
-
Endpoint 🎯: Add
jaeger.tracing:4317for the endpoint.
And that's it — Odigos is all set to send traces to our Jaeger backend. It's that simple.
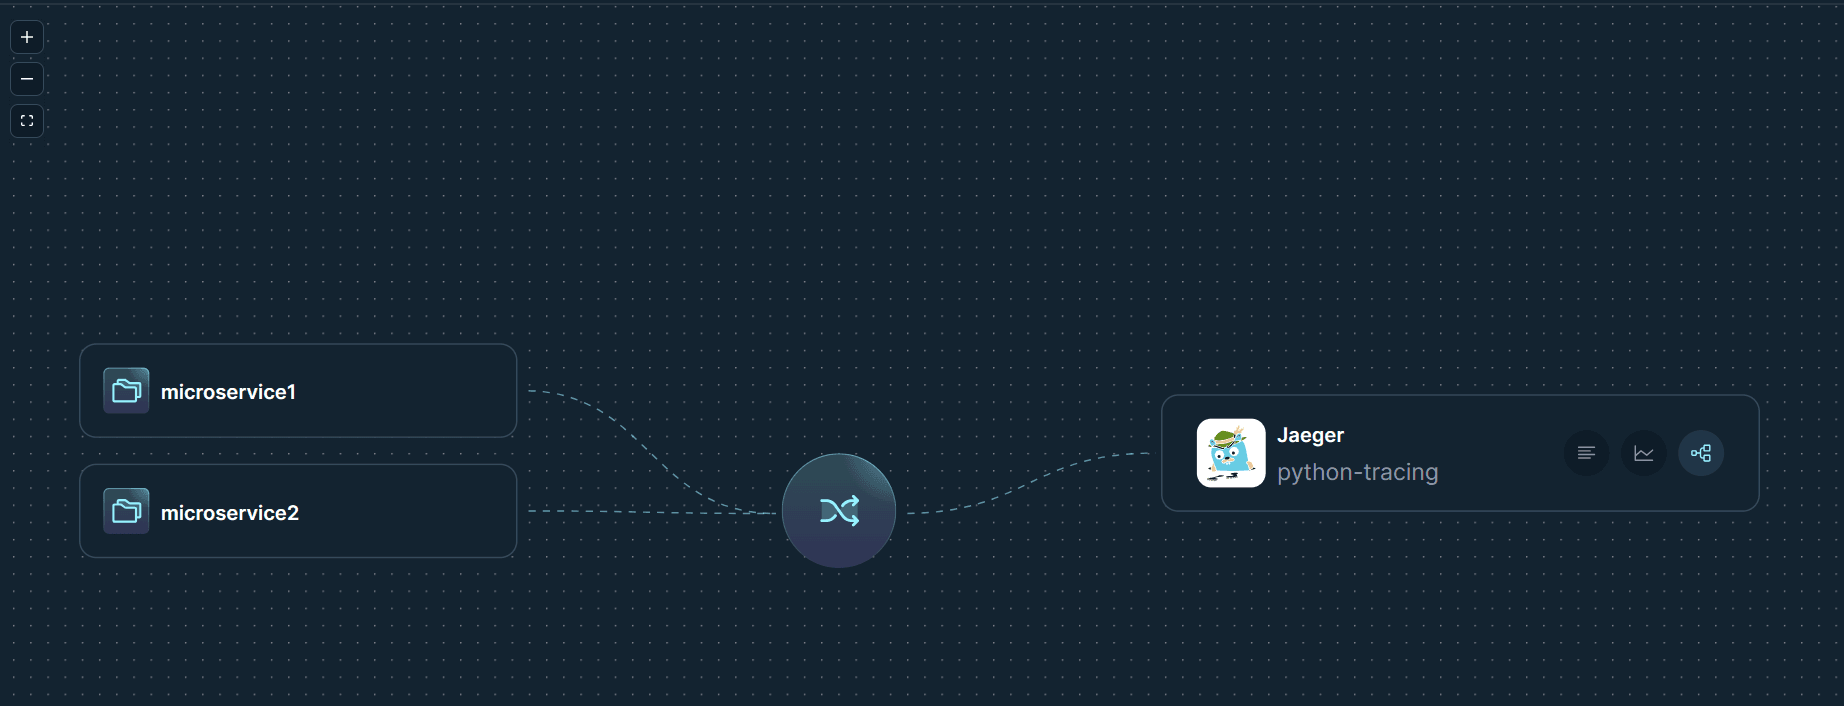
Viewing Distributed Tracing 🧐
Odigos has already begun sending traces of our application to Jaeger as soon as we set up Odigos to work with Jaeger as our tracing backend.
Visit http://localhost:16686 and select both our microservices in the dropdown.

Make a few requests to our endpoints, and eventually, Jaeger will begin to populate with traces.
Click on any of the requests and explore the traces.

This was all done without changing a single line of code. 🔥

Wrap-Up! ⚡
So far, you've learned to closely monitor 👀 your Python application with distributed tracing, using Odigos as the middleware between your application and the tracing backend Jaeger.
The source code for this tutorial is available here:
https://github.com/shricodev/blogs/tree/main/odgs-monitor-PY-like-a-pro
Thank you so much for reading! 🎉 🫡
Drop down your thoughts in the comment section below. 👇
Follow me on Socials 🐥: https://linktr.ee/shricodev